Reading Time: 13 minutes
The good news? You can build a clean, professional-looking academic Gantt chart in literally two minutes without paying for anything or learning complicated software. No Microsoft Project licence, no steep learning curve, just a free tool that spits out something your marker will actually respect.
Head over to the Gantt Chart Generator and you’ll see how straightforward it is. This tool was built specifically for students who don’t have time to fight with spreadsheets or enterprise software. It’s completely free, doesn’t ask for an account, and produces high-resolution images you can drop straight into your Word document. Perfect for those late-night panic sessions before handing in your proposal or methodology chapter.
Why this matters right now. Your dissertation or major project isn’t just about the research. Markers want to see you can actually manage your time and deliver on what you promised. A clear Gantt chart proves that. It turns vague promises into concrete, visual evidence that you’ve thought things through. And the best part? Once you’ve got the chart sorted, you stop wasting energy on formatting and get back to the actual work.
What Is an Academic Gantt Chart & Why Do Markers Care?
A Gantt chart is simply a visual timeline that shows all your tasks as horizontal bars stretching across weeks or months. Each bar represents how long you expect a particular piece of work to take, and you can see overlaps, dependencies, and buffer time at a glance.
In UK universities, these charts have become standard in research proposals, final year projects, MSc dissertations, and even some undergraduate modules. They’re not just pretty pictures. They demonstrate to your supervisor and second marker that you understand the scope of your project and have a realistic plan to finish it.
Think about it. When you submit a proposal, your marker is scanning for three things: is the research question solid, is the methodology appropriate, and can this student actually pull it off in the time available? A well-constructed Gantt chart answers that last question immediately. It shows you’ve broken the work down, allocated sensible time to each stage, and left room for the inevitable setbacks.
This planning also connects directly to the overall structure of your assignment. Many students lose marks because their project plan doesn’t line up with the actual written document. That’s why checking the Standard UK Assignment Structure: The “Introduction to Conclusion” Template helps you make sure your timeline reflects the real sections you’ll need to write.
You don’t need to be a project management expert. Academic Gantt charts are simpler than the ones used in big companies. You focus on key academic milestones: literature review, ethics approval, data collection, analysis, writing, and revisions. The chart becomes living proof that you’re organised.
Markers especially love seeing dependencies. For example, you can’t start data analysis until you’ve finished collection. Showing this visually tells them you’ve thought about the logical flow. It also highlights buffer time – those precious weeks you build in for illness, supervisor feedback, or unexpected data problems. Universities expect this level of foresight, particularly at Masters level.
❤️Need Affordable Assignment or Dissertation Support?
WhatsApp our writer NOW
(Click on the number to jump to the WhatsApp Message Section.): +44 7876 010823
Understanding UK Academic Standards & Specific Disciplines
Different disciplines in the UK have slightly different expectations for project timelines. Knowing these helps you tailor your chart so it hits exactly what your module wants.
Business Management and MSc programs usually want heavy emphasis on milestones, risk management, and applying specific frameworks. Your chart might need to show how you’ll analyse operational changes, stakeholder engagement, or strategy implementation. Markers look for clear deliverables at each stage – draft chapters, presentation slides, data sets. They also expect you to flag potential risks like access to company data or participant drop-out.
Healthcare and Nursing students, especially those working with NHS-aligned projects, need charts that reflect clinical audits, service improvement projects, or empirical evaluations. Ethics and governance approvals take longer in these fields, so your timeline must show realistic waits for IRAS or local R&D approval. Data collection often involves patients or staff, which brings additional constraints around shift patterns and access.
SQA and college-level frameworks focus more on clear progression tracking across terms. You need to show how your project builds skills week by week, with regular check-ins and portfolio evidence.
A messy timeline is one of the quickest ways to lose presentation marks. Even if your research is strong, poor visual planning can drag your grade down. That’s why experienced students treat the Gantt chart as seriously as their literature review. It’s part of the professional package.
For more ways to protect your marks through small but important details, check out 15+ University Assignment Tips to Improve Grades in the UK. The students who do best combine strong content with clean, professional presentation.
| Discipline | Common Project Phases | Typical Module Weight for Planning Element | Evidence Markers Expect on Chart | Key Dependencies | Common Time Buffers Needed |
|---|---|---|---|---|---|
| Business Management (MSc) | Topic Selection, Literature Review, Methodology Design, Primary Data Collection, Analysis, Recommendations, Final Writing | 15-20% of proposal marks | Clear milestones with risk assessment columns, stakeholder mapping, framework application stages | Ethics before data collection; supervisor feedback loops | 2 weeks for data access delays, 1 week for analysis surprises |
| Nursing/Healthcare (BSc/MSc) | Ethics Application, Literature Search, Audit Planning, Data Collection (clinical), Analysis, Service Improvement Recommendations | 20-25% | Detailed governance timelines, patient recruitment phases, compliance checkpoints | NHS approvals before any patient contact; pilot study before main data | 4-6 weeks for ethics, 2 weeks for staff availability |
| Social Sciences | Research Question Refinement, Extensive Literature Review, Mixed Methods Design, Fieldwork, Thematic Analysis, Discussion | 10-15% | Clear separation of secondary and primary research phases, reflexivity checkpoints | Access to archives or participants; transcription time | 3 weeks for recruitment, 2 weeks for transcription |
| Engineering/Computing | Requirements Analysis, Literature/Standards Review, Design Phase, Prototyping, Testing, Evaluation, Documentation | 15% | Technical milestones with testing iterations, resource allocation (software/hardware) | Equipment approval, iterative testing cycles | 2 weeks for technical failures, 1 week for supervisor review |
| SQA/College Level | Initial Planning, Research Skills Development, Data Gathering, Report Writing, Presentation Preparation | 25% of overall project | Simple weekly progression bars, evidence collection points | Tutor approval at each stage | 1-2 weeks built in for each major deliverable |
The 2-Minute Solution: Step-by-Step Guide to Using the SmallStudyTools Generator
Let’s get practical. Here’s exactly how to create your chart in under two minutes.
Step 1: Open the tool and input task names. Go to https://smallstudytools.com/gantt-chart-generator/. Start typing your main tasks. For a typical Masters dissertation think: Literature Review, Ethics Application, Data Collection, Data Analysis, Chapter Writing, Supervisor Feedback, Revisions, Final Submission. Keep task names clear and concise – your marker needs to understand them at a glance.
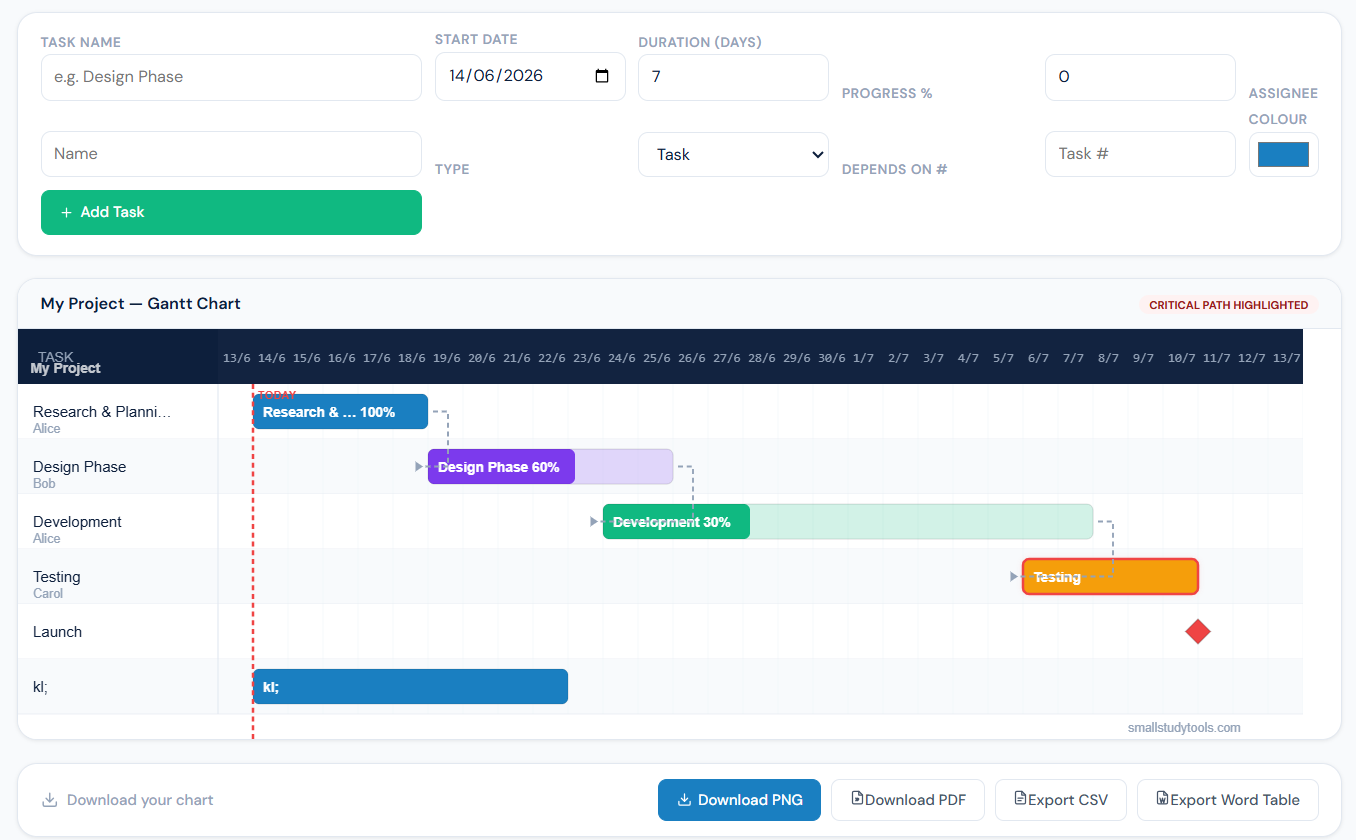
Step 2: Set realistic start and end dates. Use your university semester dates as the overall timeline. Be honest with yourself. If your literature review usually takes three weeks, put three weeks. The tool lets you drag bars easily or type dates directly. This is where most students go wrong with Excel – fighting merged cells and conditional formatting. Here, it just works.
Step 3: Customise the visual blocks. Add dependencies by linking tasks (the tool handles this automatically in many cases). You can colour-code sections – maybe blue for research, green for writing. Adjust the zoom level so your entire project fits nicely on one page. No more broken borders or printing disasters.
Step 4: Export and insert into your document. Download as a high-resolution PNG or PDF. Open your Word document, insert the image, and resize it to fit your page margins. It looks crisp and professional. Done.
Compare this to Microsoft Project, which costs a fortune and takes days to learn properly. Or even advanced Excel templates that break the moment you add one extra task. The SmallStudyTools generator removes all that friction so you can focus on content.
| Task Name | Duration (Weeks) | Start Week | End Week | Key Dependencies | Risk Mitigation Strategy | Deliverable Evidence |
|---|---|---|---|---|---|---|
| Topic Refinement & Proposal | 1 | 1 | 1 | None | Early supervisor meeting | Approved research question |
| Literature Review | 3 | 1 | 3 | Topic approval | Daily reference management | Annotated bibliography + draft chapter |
| Ethics Application | 2 | 2 | 4 | Literature Review start | Submit early, prepare alternatives | Ethics approval letter |
| Methodology Design | 2 | 3 | 5 | Literature Review | Pilot questions tested | Final methodology section |
| Data Collection | 4 | 5 | 8 | Ethics approval | Multiple recruitment channels | Raw data set + logbook |
| Data Analysis | 2 | 8 | 10 | Data Collection complete | Backup data, early coding | Coded themes or statistical results |
| Discussion & Recommendations | 2 | 9 | 11 | Analysis complete | Regular supervisor check-ins | Full draft chapters |
| Final Writing & Revisions | 1 | 11 | 12 | All previous | Dedicated proofreading time | Final submission-ready document |
| Presentation Preparation | 1 (parallel) | 10 | 12 | Writing near complete | Practice sessions booked | Slides and speaker notes |
WhatsApp our writer NOW
(Click on the number to jump to the WhatsApp Message Section.): +44 7876 010823
Comparison Matrix: Manual Excel vs. MS Project vs. SmallStudyTools Generator
| Tool | Cost | Setup Time | Learning Curve | Account Needed | Mobile Friendliness | Risk of Format Breakage on Export | Best For |
|---|---|---|---|---|---|---|---|
| Manual Excel | Free (if you have Office) | 30-60 minutes | Medium-High | No | Poor (hard to edit on phone) | High – formatting often breaks | Simple personal use only |
| Microsoft Project | £10+ per month or university licence | 2-4 hours initial setup | Very High | Yes | Limited | Medium | Large corporate-style projects |
| SmallStudyTools Gantt Generator | Completely Free | Under 2 minutes | Very Low | No | Excellent | Very Low – clean image export | UK academic submissions |
| Other Online Tools | Often £5-15/month | 5-15 minutes | Medium | Usually Yes | Variable | Variable | Students with budgets |
Balancing Project Management and Document Hygiene
Once your beautiful Gantt chart is ready, don’t ruin everything by messing up the rest of the document. Clean formatting around the chart matters. Students often copy-paste templates or use AI to speed up the surrounding text, but this can create problems with similarity reports.
Before final submission, run your work through proper checks. The AI and Plagiarism Check Service gives you peace of mind. Many universities use Turnitin, and 2026 has brought tighter AI detection. Read Turnitin AI Detection in 2026: Full Report & What UK University Students Need to Know and How to Pass Turnitin: Preventing Plagiarism in Your 2026 Assignments so you understand the current rules.
If you’re struggling with the written sections, the Assignment Assistance Service and Editing Service provide ethical support from UK academics. For full dissertations, check First-Class Masters Dissertation Help: Expert UK Writers & Research Support.
Concluding Remarks
You don’t have to stay stuck at 2 AM fighting with software. A professional Gantt chart shows your marker you’re serious about delivering a well-managed project. It takes two minutes with the right tool, and it can genuinely protect your marks.
Right now, open the Gantt Chart Generator and build yours. You’ll feel the relief immediately when that clean timeline sits perfectly in your document.
If the entire project feels overwhelming – the literature synthesis, the methodology, the presentation – you’ve got options. The Assignment Writing Service connects you with expert UK writers who understand your module requirements. Need polishing? The Editing Service makes sure everything reads at first-class standard. And if you’ve got a presentation coming up, Stop Worrying About Your 10-Minute Presentation: Professional PPT & Script Writing for UK Universities has you covered.
You’ve already done the hard part by choosing your topic and starting the research. Don’t let formatting or planning hold you back. Get the timeline sorted, protect your work with proper checks, and submit something you’re proud of.
You’ve got this. Now go build that chart and move forward with your project.
Frequently Asked Questions About Academic Gantt Charts
Q: What exactly is an academic Gantt chart and why should I bother making one?
An academic Gantt chart is a simple visual timeline that lays out every major task in your project as horizontal bars across weeks or months. Unlike corporate versions packed with dependencies and resources, the student version focuses on your key milestones: literature searching, ethics forms, data gathering, writing chapters, feedback loops, and final polishing.
Markers care because it shows you’ve thought realistically about delivery. In UK universities, especially at Masters level, a vague “I’ll just get it done” doesn’t cut it. Your supervisor wants proof you can manage a 12- or 16-week project without falling apart in the final month. A clear chart demonstrates planning, foresight, and professionalism. It can easily lift your presentation or project management marks by 5-10 points.
Q: Can I really create a professional Gantt chart in just 2 minutes?
Yes, you can. The Gantt Chart Generator at SmallStudyTools removes all the usual headaches. You type your task names, pick start and end dates using your university calendar, and drag bars to adjust. No accounts, no payment, no learning curve.
Most students waste 30-45 minutes fighting Excel borders or conditional formatting. This tool handles the visuals automatically and exports a clean, high-resolution image that drops straight into Word without breaking your formatting. I’ve seen students go from stressed mess to calm in one coffee break. It works brilliantly for dissertation proposals, research methodology sections, NHS service improvement projects, and even undergraduate final-year projects.
Q: Is the free Gantt chart tool safe and suitable for university submission?
Completely safe. The tool doesn’t store your data beyond the current session, and you don’t hand over any personal details. The output is a clean image or PDF you fully control. UK universities accept these visuals as long as they’re clear, accurate, and properly labelled.
Your marker isn’t judging the software – they care about whether your plan looks realistic and well-structured. Thousands of students have used this exact generator for submissions on Moodle, Blackboard, and Aula portals. Just make sure your dates match your actual module handbook deadlines.
❤️Need Affordable Assignment or Dissertation Support?
WhatsApp our writer NOW
(Click on the number to jump to the WhatsApp Message Section.): +44 7876 010823
Q: How do I adapt the Gantt chart for different UK courses like Business, Nursing, or Engineering?
Different disciplines need slightly different emphasis. Business Management students should highlight risk assessment, stakeholder engagement, and framework application phases. Nursing students need longer ethics and governance bars because NHS approvals take time. Engineering projects benefit from clear prototyping and testing iterations.
Use the table in the main article as your base, then tweak. For example, a healthcare student might add a 4-week ethics approval block, while a computing student adds iterative coding sprints. Always show buffer time – markers notice when students leave no room for real life.
Q: What should a typical 12-week Masters dissertation Gantt chart include?
A solid 12-week chart usually breaks down like this:
- Week 1: Topic finalisation and proposal approval
- Weeks 1-3: Literature review
- Weeks 2-4: Ethics application
- Weeks 3-5: Methodology design and piloting
- Weeks 5-8: Primary data collection
- Weeks 8-10: Analysis
- Weeks 9-11: Discussion, recommendations, and drafting
- Weeks 11-12: Revisions, proofreading, and submission prep
Add parallel tasks like presentation slide creation in the final weeks. The important part is showing dependencies (you can’t analyse data you haven’t collected) and realistic buffers.
Q: How does this compare to using Excel or Microsoft Project?
Excel is free but painful for anything beyond five tasks. Bars misalign, printing breaks, and small changes create formatting nightmares. Microsoft Project is powerful but overkill, expensive, and has a brutal learning curve most students don’t need.
The SmallStudyTools generator sits in the sweet spot: zero cost, instant results, mobile-friendly, and academic-focused. Check the detailed comparison table in the main article for side-by-side numbers on setup time, learning curve, and export reliability.
Q: What if my project timeline is longer than 12 weeks or shorter?
The tool handles any duration. For a full-year Masters project, extend the timeline to 40+ weeks and group tasks into phases. For shorter assignments or SQA modules, compress to 8 weeks and focus on weekly deliverables. The generator automatically adjusts the scale so everything stays readable.
Pro tip: Always work backwards from your final submission date. This stops you from accidentally planning past the deadline.
Q: How do I insert the Gantt chart into my Word document without ruining the layout?
Export as PNG or PDF from the tool. In Word, go to Insert > Pictures, choose your file, then set text wrapping to “In Line with Text” or “Square” depending on your style guide. Resize using the corner handles while holding Shift to keep proportions. Add a clear figure number and caption like “Figure 1: Project Timeline for MSc Dissertation”.
Place it after your methodology section or in an appendix if your university prefers. Keep surrounding text clean – avoid overlapping with heavy tables or images that might cause pagination issues.
Q: Can I update my Gantt chart later as my project progresses?
Absolutely. The best students treat their chart as a living document. Revisit the Gantt Chart Generator every couple of weeks, adjust completed tasks (maybe shade them green), and shift remaining bars. This creates a great visual progress report for supervisor meetings.
Save your original task list so you don’t have to retype everything. Taking 10 minutes to update regularly prevents nasty surprises near submission.
Q: What are the most common mistakes students make with academic Gantt charts?
Common Mistake to Avoid: Making every task the same length. Real projects have peaks and troughs. Another big one: Ignoring ethics and access delays, especially in healthcare and social sciences. Many students also forget buffer time for supervisor feedback – build in at least one week after each draft. Finally, poor labelling. Your marker shouldn’t have to guess what a bar means.
Pro-Tip 💡: Print or export a version with actual dates visible on the bars. It makes your plan much more concrete.
Q: Will using this tool or AI for planning affect my Turnitin report?
The chart itself is visual and won’t trigger similarity issues. However, if you use AI to write the explanatory text around the chart, you need to be careful. Always run the full document through proper checks.
Q: What if I’m struggling with the entire dissertation, not just the timeline?
The Gantt chart is one piece of the puzzle. If the full project feels overwhelming – literature synthesis, methodology, or upcoming presentation – get targeted help. The Assignment Writing Service connects you with UK academics who understand your exact module. For polishing, the Editing Service is excellent.
❤️Need Affordable Assignment or Dissertation Support?
WhatsApp our writer NOW
(Click on the number to jump to the WhatsApp Message Section.): +44 7876 010823
Q: Is the tool mobile-friendly? Can I build it on my phone?
Yes. The generator works well on both Android and iOS browsers. You can start the chart on your laptop and fine-tune on your phone while commuting or between lectures. The exported image still looks sharp when inserted into your document.
Q: How detailed should my Gantt chart be?
Aim for 8-12 main tasks. Too many micro-tasks make it cluttered and hard to read. Group smaller activities under bigger headings (e.g., “Data Collection” covers recruitment, interviews, and transcription). Your marker wants clarity, not a microscopic breakdown.
Q: Can I use this for group projects or collaborative assignments?
Definitely. Share the generated image or have each team member input their responsibilities. Colour-code sections by person. It becomes strong evidence of coordinated planning – something group project markers specifically look for.
Q: What if my university has very specific template requirements?
Most UK universities are flexible on visuals as long as they’re clear and professional. If your module provides a specific template, use the generator for the timeline and copy the style manually. The tool’s clean output usually matches what’s expected.
Q: How often do students actually improve their grades by adding a Gantt chart?
From what tutors and markers report, a clear, realistic timeline consistently lifts marks in the “planning and organisation” criteria. In competitive modules where many students score 60-65%, a professional chart can push you into the 70s by showing genuine project management thinking.
You’ve got access to everything you need right now. Build your chart in the next few minutes using the free generator, then focus on the actual research. You don’t need perfection – you need something practical that shows you’re in control.
If you still feel stuck with the bigger picture, reach out for the right support package. Plenty of students in your exact position have turned things around this way.
❤️Need Affordable Assignment or Dissertation Support?
WhatsApp our writer NOW
(Click on the number to jump to the WhatsApp Message Section.): +44 7876 010823